There’s a new map for: 2008 turnout in Spokane
A reader was wondering about lower turnout areas in the city of Spokane, specifically questioning whether the lack of certain candidates on the ballot was responsible for the lower turnout in the city's Northeast Council District, West Central and East Central.
Probably not.
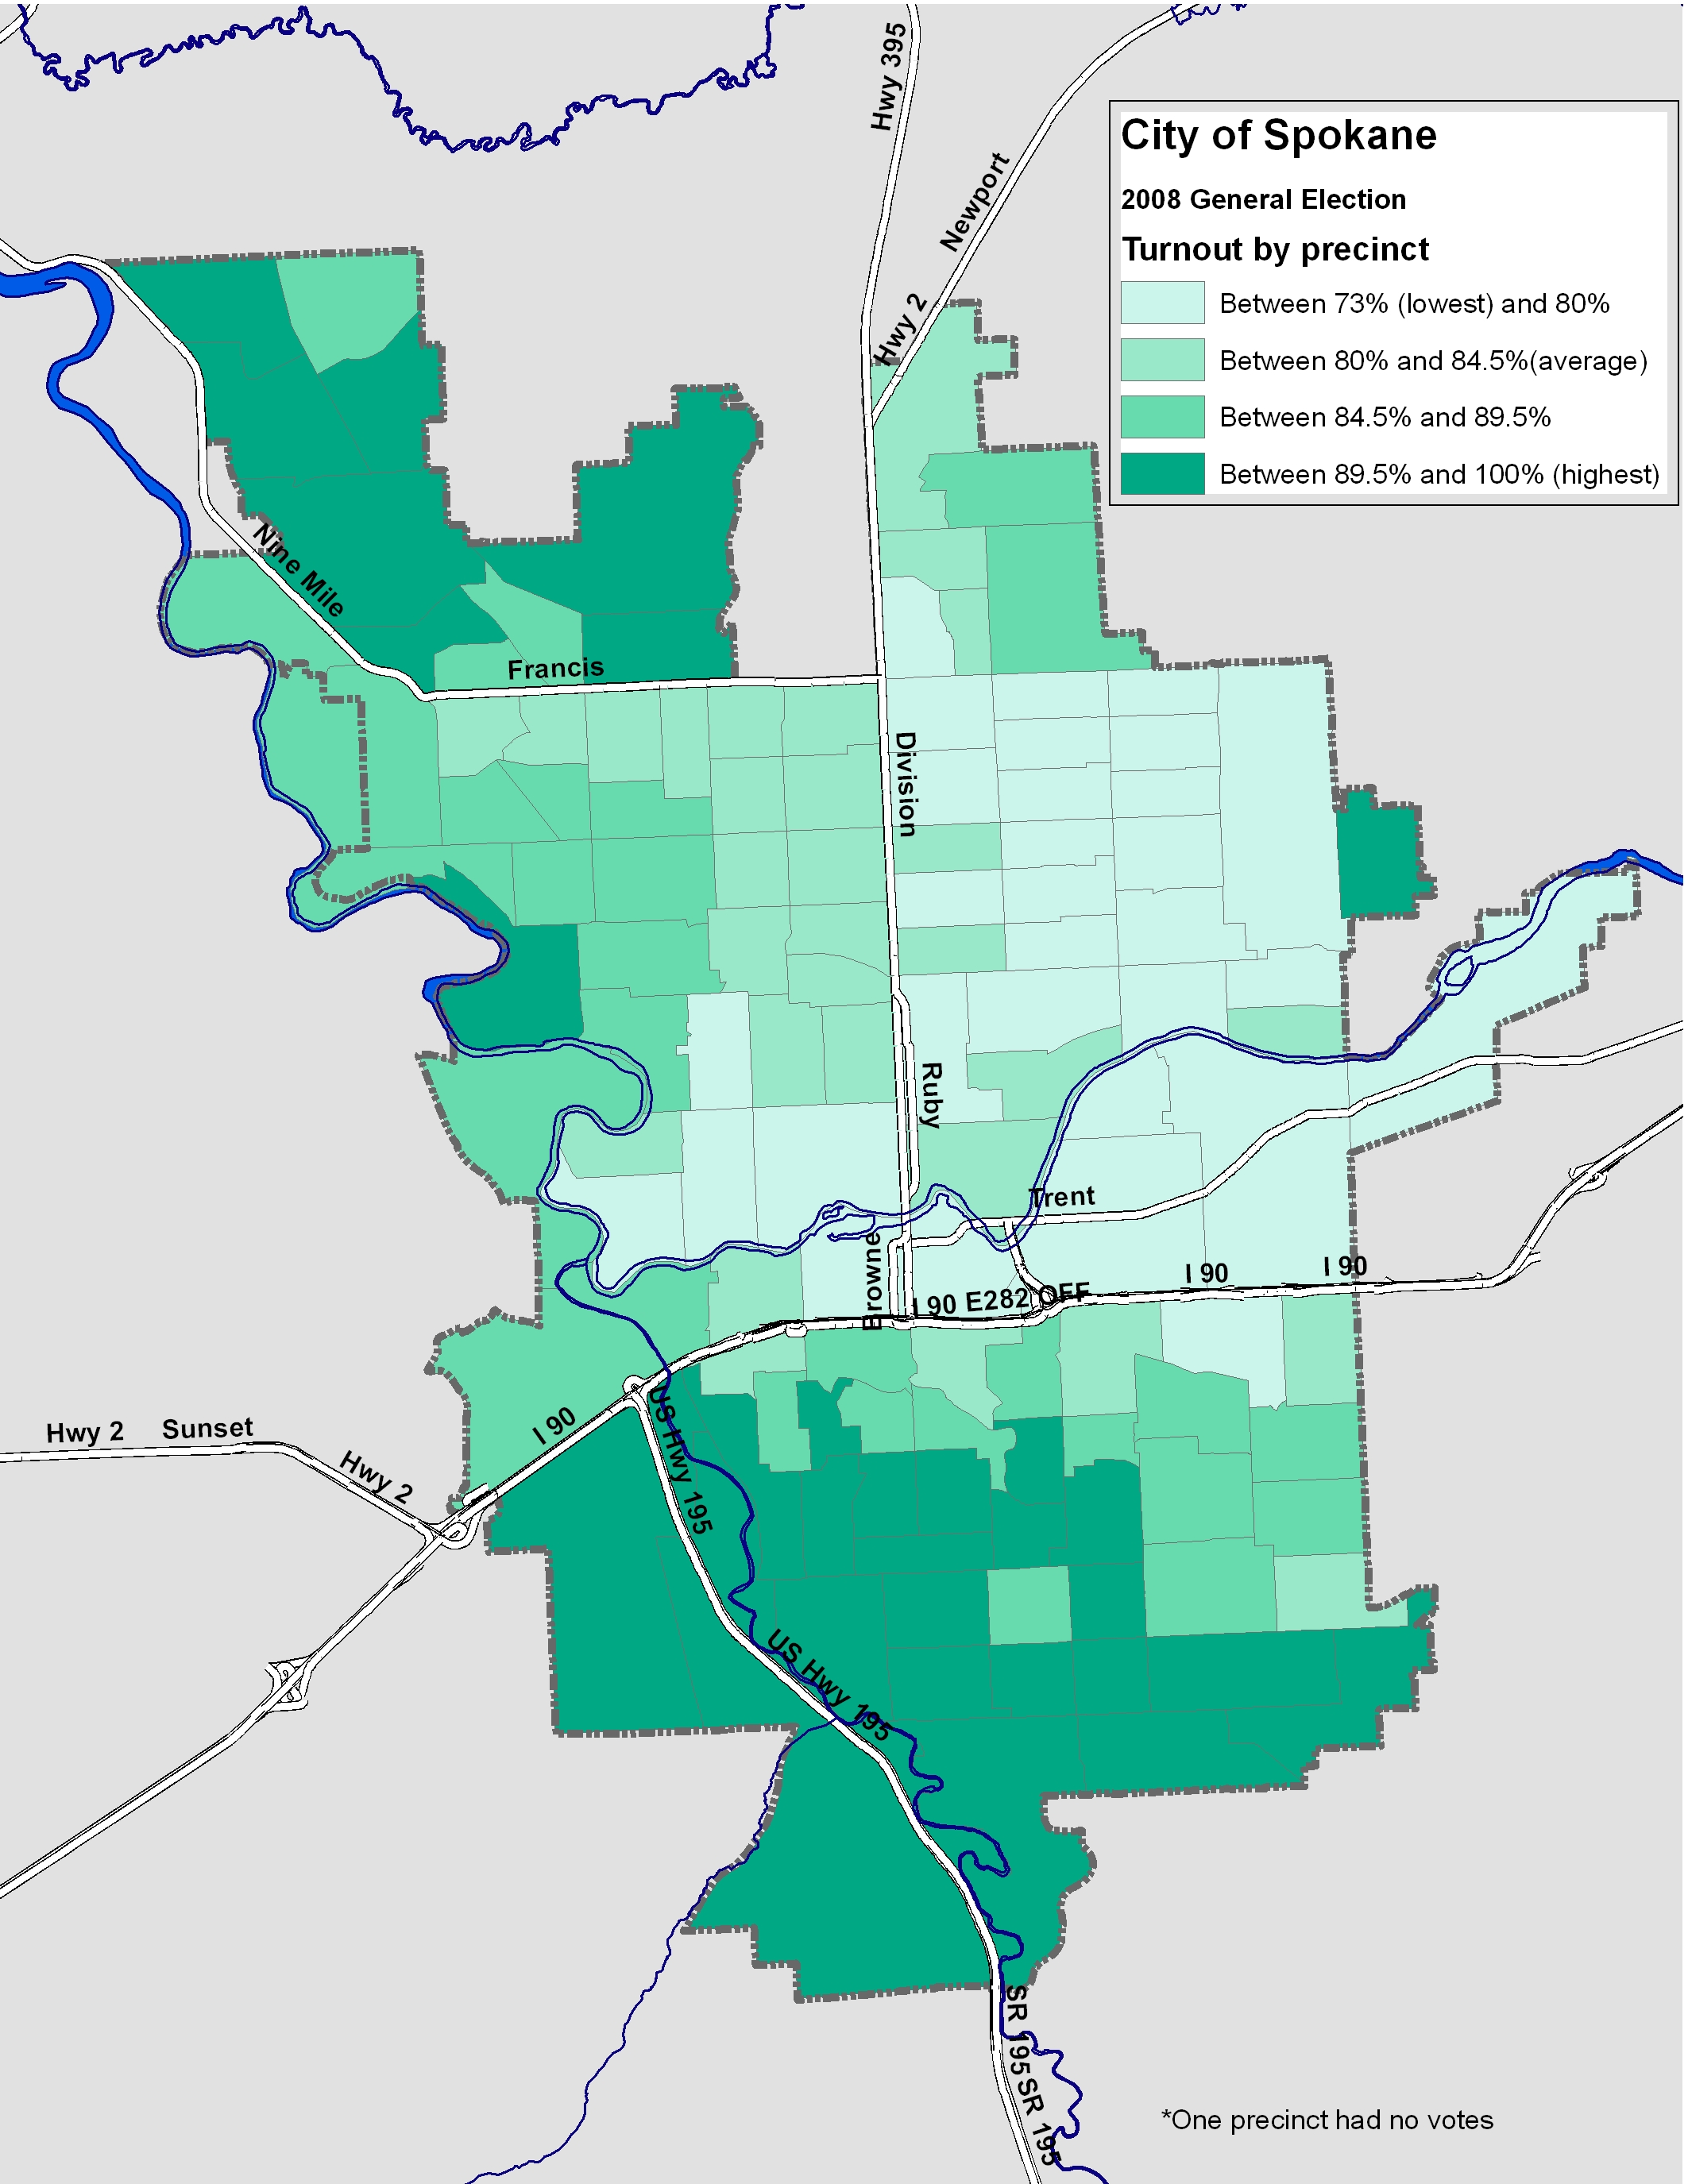
This is a map of last year's general election turnout in the city of Spokane, which set a record in terms of total votes and percentages.
Compare it to this year's city turnout, and it seems pretty clear that in relative terms, turnout was RELATIVELY low in most of the same areas, and RELATIVELY high in most of the same areas. Remember that turnout is a comparison of the number of ballots divided by the number of registered voters in each individual precinct, and then the percentages -- not the total number of votes -- are compared among the precincts.
The total number of votes varies greatly from election to election, but the relative turnout for different areas of the city remains fairly constant.