Symphony of the salmon: How scientists are learning by putting fish migration to music

What if you could compose music to understand how salmon migrate through rivers? A team of researchers from the University of Idaho and Eastern Washington University have found a way to do just that.
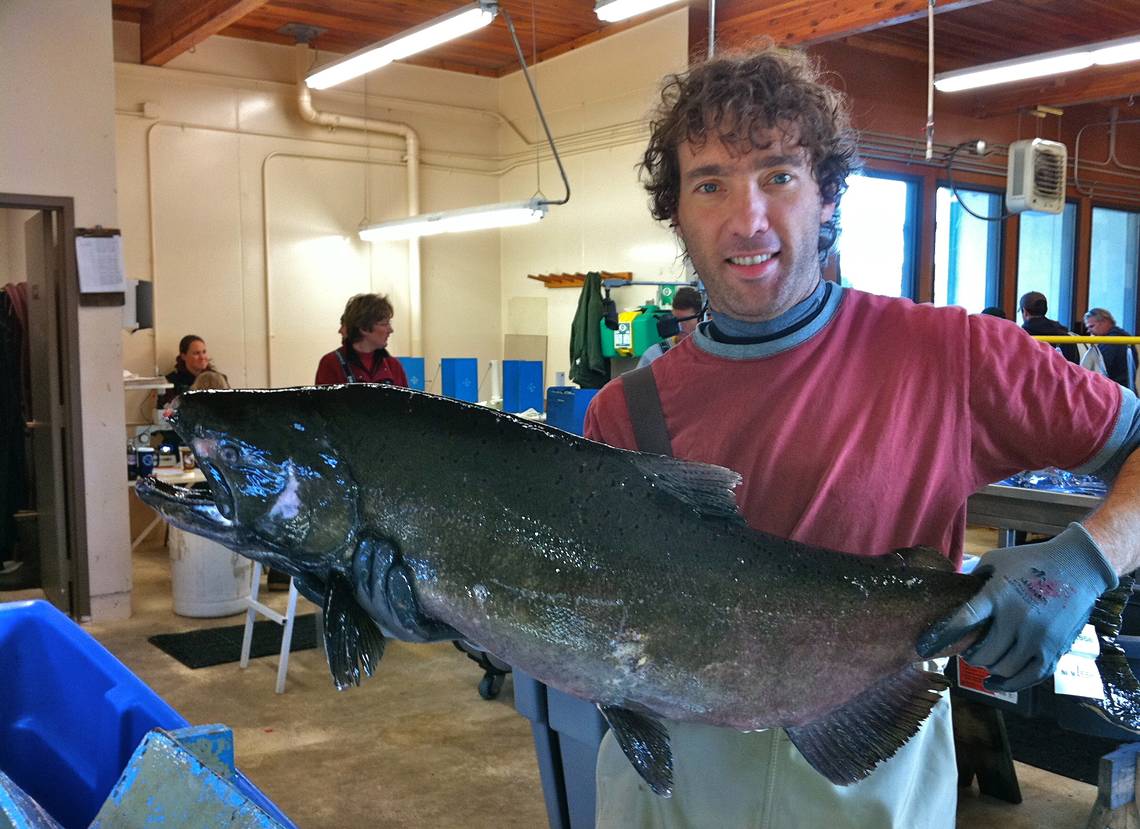
Chinook salmon, such as those that migrate to and from Idaho up the Snake and Columbia rivers, are one of Idaho’s most popular sports fish and integral to the region’s economy, ecology and identity. Understanding in detail their migratory habits is key to understanding how dams and other man-made influences affect their survival and the river ecosystem writ large.
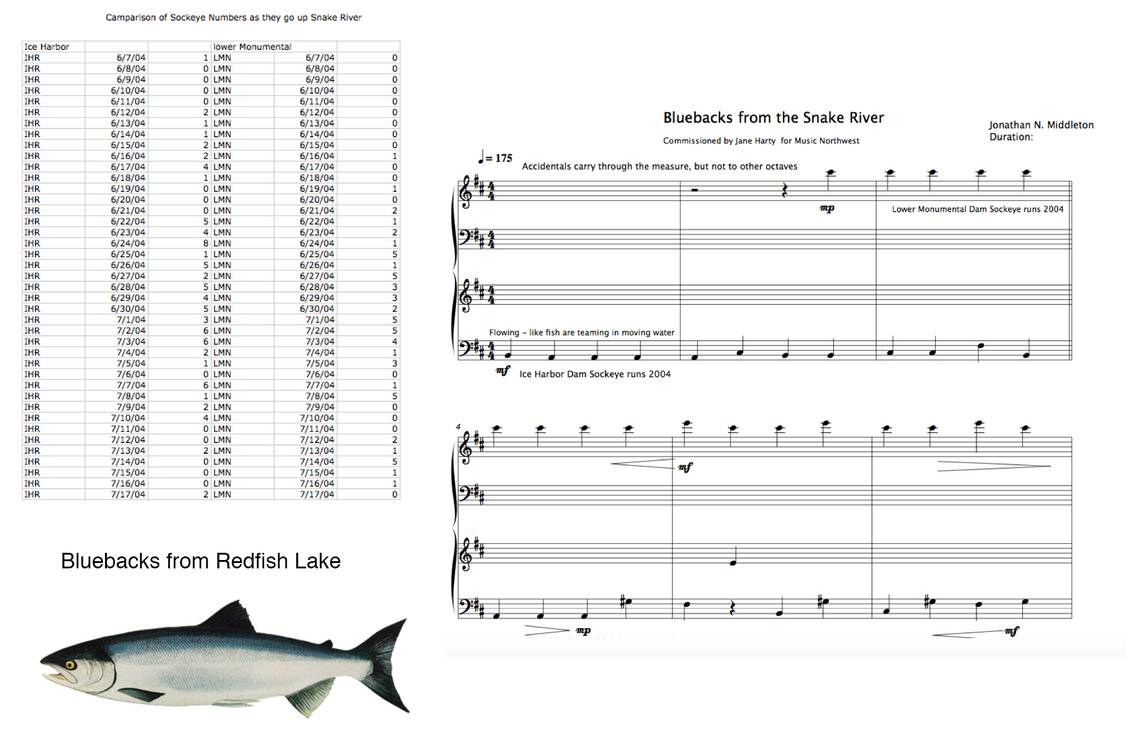
To examine that migration in a completely new way, researchers used music to analyze huge amounts of salmon location data collected from the inner ears of fish, according to a report published in the journal Heliyon. “We’re just getting tons and tons of rich data and we’re looking for better ways to visualize it,” says Jens Hegg, analytical lab manager in the Kennedy LIFE lab at the University of Idaho and lead author of the study.
It’s a process called “sonification.” But why use sound and music to examine fish data?
Translating massive amounts of data — whether from migrating fish, the stock market or the energy from the sun — into sound makes it accessible in a new and intuitive way, for scientists and laymen. It lets people hear trends and changes that viewing the data doesn’t reveal, the way that doctors have started listening to a patient’s electroencephalogram (EEG) to detect the onset of a seizure.
Moreover, the burgeoning science may one day allow insights into huge data sets that scientists can’t yet envision.
“We can deal with the entirety of the data in ways we just don’t have right now statistically,” says Hegg.
Like reading tree rings
Inside the inner ears of all vertebrates, humans included, are small stones called otoliths. They are used by all of us to orient ourselves in space and perceive the acceleration of our bodies. In fish, ecologists have found more uses.
Otoliths are made up of calcium carbonate, the same material that makes up egg shells and pearls. As the fish grows, it pulls calcium from the water and deposits layers of calcium carbonate on the otoliths. The rate of deposition changes throughout the year with the seasons. When the fish dies, scientists can extract the stones and read the layers — like we read tree rings — to tell the age of the fish.
As the fish moves from river to river, trace elements in the water change. These chemical differences act like a fingerprint identifying the locations the fish has visited. By reading the layers of the otolith, scientists can work out where the fish has been over its life. “It’s like the black box of the fish,” says Hegg.

The trouble isn’t getting the data, it’s interpreting it. To understand how whole fish populations move, scientists need to look at a lot of data. This quickly becomes visually confusing.
Sound, however, is multidimensional in a different way. Our brains can untangle complex mixtures of sounds much better than images, something referred to as the “cocktail party problem.”
“You can be hanging out, listening to a band, talking to your friend,” says Hegg, “and you can understand them or hear when the drummer messes up or when the guitar player misses a note.”
Enter Jonathan Middleton, chair of the Department of Music and professor of theory and composition at Eastern Washington University. Middleton has spent a lot of time in the past decade translating numbers into music. “I’m a composer and I wanted to explore new ways of composing,” he says.
He’s worked with economists to listen to the stock market and with geneticists to listen to the code of DNA. “What I like most about what I’m doing is that it takes me outside of my box.”
Audio cues are effective at conveying a different kind of information than visual cues. The classical example, Middleton says, is the Geiger counter — “how nasty it sounds with its clicks near deadly radiation.” Those clicks convey the seriousness of what is being detected in a way that a flashing light won’t: “It’s visceral, it’s really engaging.”
In the same way, using sound to interpret data helps make sense out of complexity and conveys information stored in the data that is inaccessible any other way.
‘Listening’ to chemicals
Along with Ben Luca Robertson, now at the University of Virginia, Middleton worked to assign musical elements to different chemical markers found in the otolith layers of 45 adult chinook salmon. The two main elements the composers used were pitch and timbre.
Pitch is the most effective indicator, according to Middleton. When pitch is altered, “our minds say ‘hey, something has changed, something is different.’” Different chemicals were assigned different pitches. A lot of work went into choosing not only the pitches, but their relationship to each to generate a pleasing result. As the fish moved from one location to the next, the musical chord structure would change, similar to the way a guitar player changes chords.
Timbre is like the sound’s color. It’s how we can tell the difference between a clarinet and a violin. By changing the timbre of each chemical marker, it enhances the listener’s ability to detect subtle changes, especially when more fish are in a single location. If only pitch is used, changing the number of fish simply changes the volume, something humans are not as good at detecting.
Changing these data into sound allows people with no scientific knowledge to identify subtle changes and record them. In the experiment, Hegg had untrained participants listen to the data and use a handheld clicker to identify transitions, even though they didn’t know what those transitions represented.
“How they self-identified what ‘transition’ meant mattered,” says Hegg. Some people would click deliberately at major transitions. Others would click more rapidly. Individually, Hegg found that they were not particularly accurate at identifying important changes in the data. When many participants’ results were combined, however, the researchers could filter out the noise and identify interesting structures the participants agreed upon. What the researchers learned from crowdsourcing the data, says Hegg, turned out to be the most interesting result from the study.
Interestingly, when researchers combined the audio with a visual display to help interpret the data, participants did worse. The visuals seemed to interfere with their ability to listen — an experience we’ve all had in our lives, because our sensory bandwidth is limited. This indicated that sonification was an effective tool all by itself, says Hegg.
The team is excited about the potential uses for the technique. “What they get out of this is a more enhanced experience with their data,” says Middleton.
