Report: Spokane’s greenhouse gas emissions changed little from 2017 to 2019
Greenhouse gas emissions produced within the city of Spokane stayed relatively unchanged between 2017 and 2019, according to a recent report.
While this compares favorably to statewide emissions, which rose 7% during the same period, some climate experts worry it doesn’t show enough progress to meet ambitious reduction goals by the end of this decade.
“Say you went to the doctor, and the doctor has told you that you really need to lose weight or you could have severe health concerns,” said Brian Henning, director for the Center for Climate, Society, and the Environment for Gonzaga University.
“What the report says, unfortunately, is that we’ve not lost any weight,” he continued. “That’s concerning, because we’ve made no progress towards our goals, we’ve not lost any weight and we’re in danger of severe health consequences.”
The Greenhouse Gas Inventory, commissioned by the city and produced by the Seattle-based and women-owned Cascadia Consulting Group, splits its findings into two buckets: all emissions produced within the roughly 70 square miles of the city of Spokane, and emissions produced only by city government operations. That includes operations that take place outside city limits, such as at the Southside Landfill.
The report is not particularly granular, giving a top-level view of emissions across sectors. While the report shows a slight decrease in industrial emissions due to decreased natural gas use, for example, it doesn’t indicate which businesses led to the reduction, nor whether the change is long-term or just a fluctuation.
While some data can be measured directly, such as how many gallons of diesel fuel were used, other data is modeled or predicted based on the best available data, said Cadie Olsen, Spokane’s director of Sustainability Initiatives, in an email.
The report measures total emissions in “metric tons of carbon dioxide equivalents,” a standardized way to measure the climate effects from greenhouse gases using carbon dioxide as the yardstick.
Communitywide emissions in 2019 were roughly 1.97 million metric tons of carbon dioxide equivalents, increasing by about 500 metric tons since 2017.
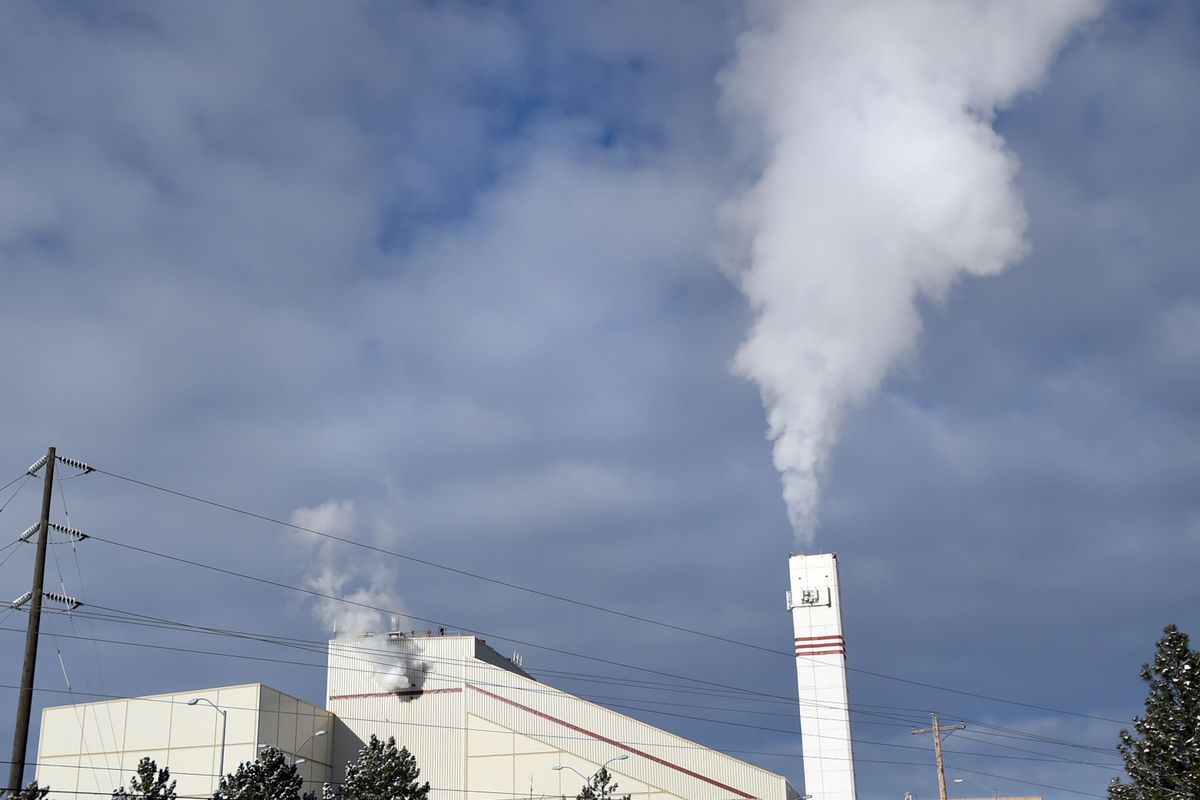
The largest drop in community emissions between 2017 and 2019 was due to reduced natural gas consumption in commercial and industrial sectors, according to the report, while the largest increases came from the transportation sector and the city’s Waste-to-Energy facility that incinerates garbage.
A majority of the community’s greenhouse gas emissions are from energy consumption, with 30% of all emissions due to residential energy use and 23% from commercial or industrial use. Another 2% comes from distribution losses, the amount of electricity lost during transmission from the plant to a home, business or other user.
Transportation made up another 33% of total community emissions, the vast majority of which came from passenger vehicles, trucks and other on-road vehicles.
Another roughly 6% of the community’s greenhouse gas emissions come from refrigerants. The city’s Solid Waste operations, including the Waste-to-Energy Plant but also garbage trucks, produced another 6% of communitywide emissions in 2019.
Emissions produced by city government operations represent about 7% of the community’s total emissions and increased by about 5% between 2017 and 2019. The lion’s share of that increase is due to the Waste-to-Energy facility.
The data comes with a number of caveats. Emissions from city operations in 2017 may have been lower than normal due to scheduled maintenance on the Waste-to-Energy plant, which caused it to be offline for extended periods of time.
The city has commissioned five similar Greenhouse Gas Inventories since 2009, though the study’s methodology has changed frequently. In 2017, the city passed an ordinance requiring that a study be done more frequently with snapshots of three years at a time.
For this most recent round, the city of Spokane joined the International Council for Local Environmental Initiatives, allowing the city to use the ClearPath reporting tool to track emissions, said city Environmental Analyst Logan Callen during a Monday meeting with the City Council.
Not only can the data be used to apply for funding and grant opportunities, it can help the city identify where it has reduced emissions and where it needs to improve to meet its climate goals, Callen said.
Emissions produced in 2016 are supposed to be used as the benchmark for pollution reduction. In 2021, the city committed to emit no more than 55% of 2016 emissions by 2030, 30% by 2040 and be net zero by 2050.
But an apples-to-apples comparison can’t be made between the recent report and 2016 data, in large part because the city changed how it reports the data.
And while estimates of the diesel burned or refrigerants released in a year might not change, there are frequently changes in estimates for how impactful different kinds of emissions – carbon dioxide versus methane, for instance – are on the climate, said Henning.
“We have this pattern now, going back several administrations, where each of these inventories used a different methodology, so you can’t make useful comparison across those,” Henning said.
In order to accurately track progress going forward, the city will need to update its analysis on the 2016 data.
Future inventories will likely use the ClearPath system, Callen said. The next inventory, covering 2020 through 2022, is expected to be released in 2024.
A clear path forward?
While the city of Spokane hasn’t yet demonstrated that it’s producing fewer greenhouse gas emissions than in 2016, city leaders haven’t been sitting on their hands for the past four years.
Not long after the city committed in 2021 to reduce emissions to net zero by 2050, Spokane adopted major updates to its Sustainability Action Plan to meet its goals.
That plan primarily focuses on ways to decarbonize the city’s built environment –replacing gas furnaces with heat pumps, or installing solar panels, for example – and the transportation sector, said Kara Odegard, who until December led the city’s efforts to update the sustainability plan.
This includes initiatives to encourage residents to adopt electric vehicles, to replace the city’s fleet with electric vehicles and to invest in public transportation, Odegard said.
Some of the changes will likely come from actions by state or federal governments, such as with policies adopted last year by the state building code council eliminating new gas hookups starting in July.
While such policies may address new construction, there will be a need for decadeslong investments in older buildings, Odegard said.
“The real challenge there is cost: It’s really expensive to replace gas furnaces and upgrade heat pumps,” she said.
Other creative solutions will be needed to move the needle all the way to zero, Odegard noted, pointing to work that Tacoma is doing to capture methane from their wastewater treatment plant and converting it to compressed natural gas for use in city garbage trucks.
While the solutions might be technical, the problem is urgent, Henning said.
“In 2021 we had the heat dome, and 157 people in the state died,” he said. “Now we have something called ‘smoke season.’ The consequences are here, and real, and being felt by the community.”