2010 Census: Another legislative district map
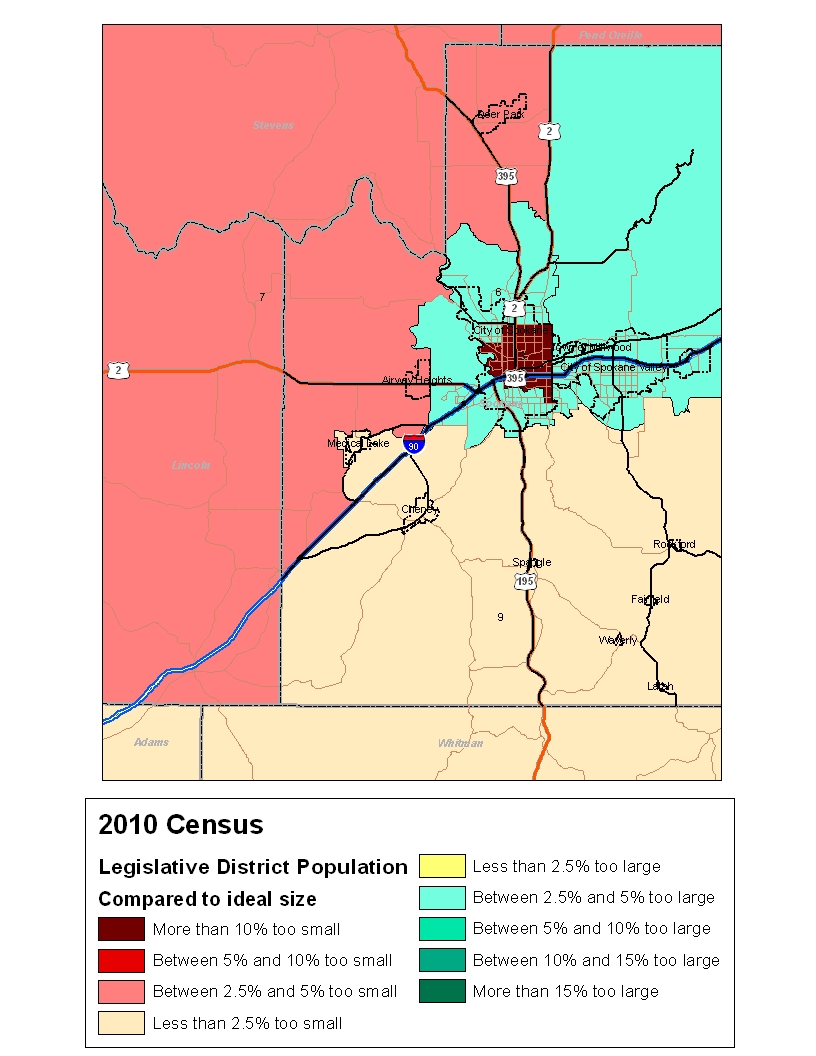
Last night’s post discussed the population in Washington’s legislative districts and had a statewide map. But we also generated more local maps for analysis. Here’s a Spokane County map tied to the same color key.
| District | 2010 population | Growth since 2000 | Difference from ideal 2012 size | Rank by population |
| 3rd District (central Spokane city, includes Hillyard, Northtown, West Central, East Central, Logan, downtown, lower South Hill.) | 120,601 | 314 | -16,635 | 2nd smallest. |
| 4th District (City of Spokane Valley, Liberty Lake, Millwood and areas north to Pend Oreille County line) | 141,254 | 20,968 | 4,018 | 14th largest |
| 6th Distric t (Parts of Spokane city and county, including Whitworth, Indian Trail, Latah Creek, South Hill above 17th Avenue, parts of Moran Prairie, parts of West Plains east of Airway Heights) | 141,123 | 20,830 | 3,887 | 15th largest |
| 7th District (Pend Oreille, Stevens, Ferry, Lincoln counties, parts of Okanogan and Spokane counties, including Deer Park, Airway Heights, Fairchild Air Force Base and nearby portions of West Plains.) | 130,475 | 10,185 | 6,761 | 15th smallest |
| 9th District (Asotin, Garfield, Whitman, Adams counties, parts of Franklin and Spokane counties, including Cheney, Medical Lake, small towns and most of rural areas in the southern third of county.) | 136,199 | 15,879 | 1,070 | 27th smallest |
* This story was originally published as a post from the blog "Spin Control." Read all stories from this blog