This column reflects the opinion of the writer. Learn about the differences between a news story and an opinion column.
Spin Control: Elections data shows if you voted, not how you voted
Voters line up to deposit their ballots into a drop box at the Spokane Library South Hill branch in October 2020. (DAN PELLE/THE SPOKESMAN-REVIEW)Buy a print of this photo
A reader who is a regular voter and follows the newspaper’s election coverage wrote recently with several questions about the security of her ballot and the maps we often publish to show how people voted.
Having just marked, sealed and sent off her ballot, she feared she had the “illusion” that her vote is confidential but that there might be ways elections workers could tell how individuals in a household could vote.
This seemed to be reinforced by the maps the paper publishes showing how different neighborhoods or counties vote in different races. So she wondered what level of detail is known and by whom, and under what authority the information is being released.
We get variations of these questions every election, but with recent efforts to undermine the public’s confidence in elections, her letter provides an opportunity to address them all at once.
The first and most important point is that no one – not election workers nor the newspaper’s map makers – can tell how anyone voted in this or any previous election. The elections office has records of who voted because a voter is credited with voting when his or her ballot envelope arrives in the mail and the signature on the outer envelope is matched with the signature on file. If it doesn’t match, it’s set aside so the voter can be contacted and given a chance to reconcile the signature.
A ballot envelope that passes the signature check is opened and the ballot is removed in the inner security envelope and placed with other checked ballots – also still in their security envelopes – for later removal and scanning. There is nothing on the ballot itself that identifies the voter, so by the time it is run through the computer and tabulated, everyone’s vote is anonymous.
Just as they were before Washington went to mail-in balloting when people went to the polls, votes are tabulated by precinct. In cities, a precinct is typically a few blocks; in suburbs it might be somewhat larger, and in rural areas it might cover many square miles. It might have a few dozen or a few hundred voters, but the precincts are numbered in such a way to reveal what legislative district, city – and in the case of the city of Spokane – council district those voters are in. The political parties use the precincts as the building blocks of their grassroots organizations.
The elections office reports the precinct breakdowns for each race, which also isn’t new. They did it before computers and mail-in voting, and the newspaper’s archives are filled with old printouts of those results. The big difference now is that rather than poring through a stack of papers several inches thick, it’s possible to get the breakdown for each race in Spokane County on the Elections Department’s website, as they are posted on election night and updated after each round of ballot counting thanks to the work of Elections Manager Mike McLaughlin and his staff.
All this information is public record and has been for decades. It’s one way to check the accuracy of an election, because if 200 people voted in a precinct and 199 voted for one person and only one person voted for the other, it might be a reason to check the paper ballots – which the elections office keeps for months afterwards – to verify those results.
That precinct data is used by the newspaper for the maps it publishes in the days after an election. They are downloaded into a spreadsheet for some basic calculations, such as margin of votes separating the candidates in each precinct or the percentage of turnout, then fed into a Geographic Information System computer mapping program that overlays those results on a precinct map with city boundaries, some major roads and other geographic features like the Spokane River.
Versions of those maps are sent to Molly Quinn, the newspaper’s very talented and, when necessary, very patient illustrator, to make a map that will reproduce both in the pages of the paper and on the website. Some people would like us to put in all the streets, so they could locate their precinct, but size limitations don’t allow that.
The maps don’t show how any one person voted or even who voted. A record of each voter’s history of casting a ballot – or not – in an election is available as a public record, but it can’t be linked to the precinct data. That’s because in every election there are people who leave some of the races unmarked or mark more than one candidate, or write-in a name not on the ballot, and the computer only records that it happened, not who did it.
Those unmarked ballots are the reason, when you add up the votes for all the candidates for one countywide or legislative district’s race, you often get a different total than when you add up the votes for the candidates in another race in that same county or district. But even the data from those races can tell you something.
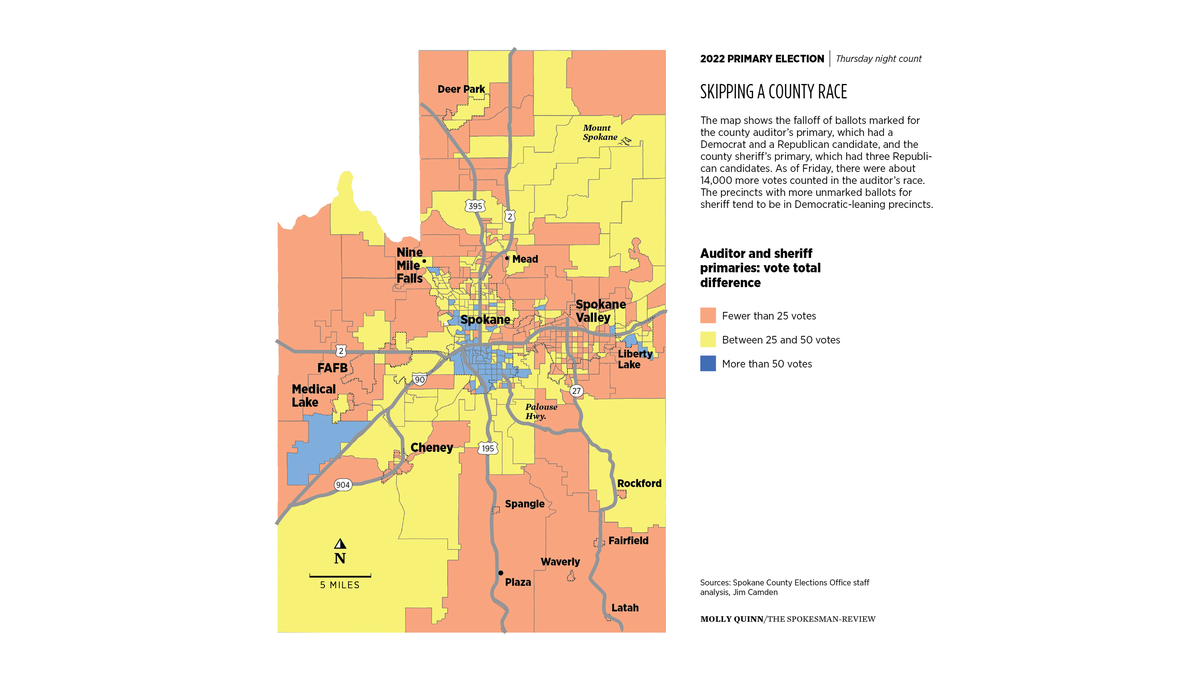
On election night, we noticed that the number of unmarked ballots in the Spokane County sheriff’s primary, which had three Republican candidates, was much larger than the number of unmarked ballots for the county auditor’s primary, which has only two candidates but one from each party. For this column, we downloaded the total votes cast for the candidates and the write-ins, then calculated the differences for each precinct, which as of Friday was about 14,000 fewer marked ballots votes in the sheriff’s race than the auditor’s race.
We fed those numbers into the mapping software to show the number of unmarked ballots per precinct. Although it didn’t tell us who didn’t mark their ballot, it did suggest why.
The greatest number of unmarked ballots were in precincts that tend to vote heavily Democratic in most elections, while the fewest number of unmarked ballots are in precincts that tend to vote Republican.
That’s fairly logical, because many Democrats might not care which Republicans make it through the primary and can always pick the one they like best (or dislike least) in the general election. But even though both Auditor Vicky Dalton and her Republican challenger Bob McCaslin will automatically advance to the general election, members of both parties might be inclined to show their preference.

